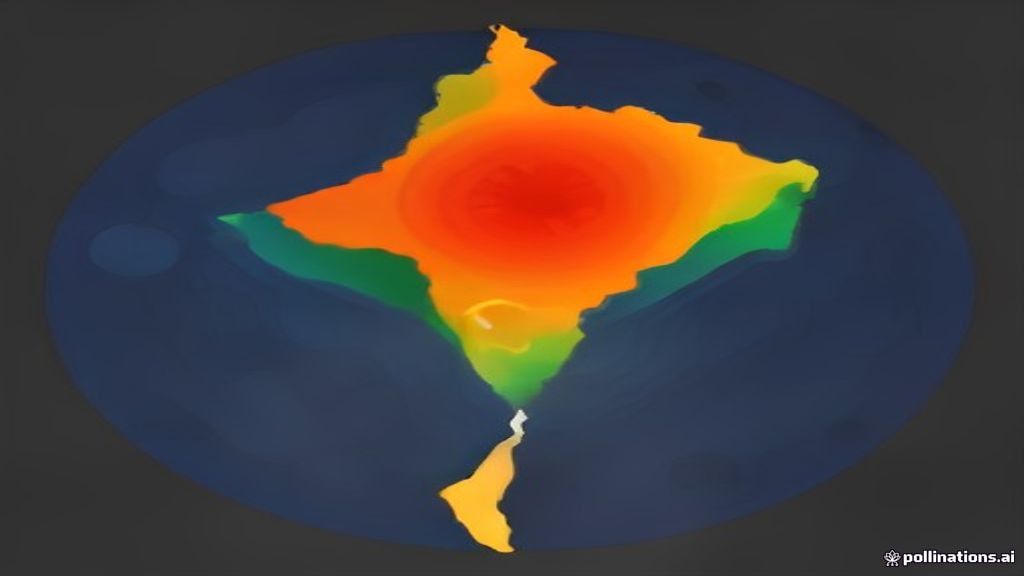
Why does population matter to you?
Ever wondered why some Indian cities feel jam-packed while others feel almost empty? That’s population at work – shaping jobs, roads, and even the food on your plate.
💡 In Simple Words: Population growth is how the number of people in a place changes over time. Distribution is simply where those people are spread out – some spots are crowded, others are quiet.
Population Growth: The Big Picture
Population growth is the increase in the total number of people living in a region over a period of time. It’s usually expressed as a growth rate – the percent change per year. India’s growth rate has slowed from about 2.2% in the 1990s to around 1% today, but the sheer numbers keep climbing because the base population is huge.
Think of it like a bathtub filling with water. The tap (births) adds water, the drain (deaths) removes water, and migration is like pouring water in from a side bucket or spilling it out.
Key Concepts You Must Know
- Population density – the number of people living per square kilometre. Imagine a pizza: the more slices you cram onto the same size, the denser it is.
- Carrying capacity – the maximum number of people an environment can support without running out of resources, similar to how many guests your kitchen can feed before you run out of plates.
- Malthusian theory – a classic idea by Thomas Malthus who warned that population grows faster than food supply, leading to shortages unless checked.
- Population pyramid – a graph that looks like a pyramid, showing how many people are in each age group. A wide base means many youngsters; a narrow top means few elderly.
How to calculate growth rate
Growth Rate (%) = [(Population at end – Population at start) / Population at start] × 100
Example: If a town had 120,000 people in 2020 and 126,000 in 2025, the growth rate = [(126,000‑120,000)/120,000]×100 = 5% over five years, or about 1% per year.
Factors Shaping Population Distribution
People don’t scatter randomly; they follow a few basic pull‑and‑push forces:
- Physical factors – water, soil, climate. River valleys and coastal plains attract more people, just like you’d set up a picnic where there’s shade and water.
- Economic factors – jobs and income. Cities with factories or IT parks pull workers from villages.
- Social‑cultural factors – language, religion, community ties. Some groups stay together for festivals or family support.
- Political factors – policies, security, and infrastructure. A well‑connected highway can turn a sleepy town into a bustling hub.
Demographic Transition Model (DTM)
The DTM explains how a country's population growth changes as it develops. It’s split into four stages, each with a distinct pattern of birth and death rates.
Quick comparison of the four stages
| Stage | Birth Rate | Death Rate | Population Growth | Typical Countries |
|---|---|---|---|---|
| 1 | High | High | Low or fluctuating | Pre‑industrial societies |
| 2 | High | Declining | Rapid increase | Early‑industrial India (19th c.) |
| 3 | Declining | Low | Slowing growth | Modernising economies like Brazil |
| 4 | Low | Low | Stable or slight decline | Developed nations – Japan, Germany |
India is currently in Stage 3 – birth rates are falling thanks to education and family planning, while death rates stay low because of better health care.
Putting It All Together: Why It Matters for Exams
When you see a map with colour‑coded density, remember it’s just a visual of the numbers we talked about. Questions often ask you to link a region’s density to the physical or economic factors we listed. Also, be ready to sketch a simple population pyramid or explain which stage of the DTM a given country belongs to.
📝 Likely Exam Questions
- Explain the demographic transition model and state which stage India is in.
Answer: The DTM has four stages showing how birth and death rates change with development. India is in Stage 3 – birth rates are falling, death rates are low, leading to a slowing population growth. - Calculate the annual growth rate if a state's population rose from 50 million to 55 million in 10 years.
Answer: Growth Rate = [(55‑50)/50]×100 = 10% over 10 years → 1% per year. - What are the main physical and economic factors influencing population distribution in India?
Answer: Physical – fertile river plains, moderate climate, water availability. Economic – industrial hubs, job opportunities in metros, better infrastructure. - Draw a simple population pyramid for a country with high birth rate and low death rate.
Answer: Sketch a wide base tapering quickly, indicating many children and few elderly. - Briefly describe Malthusian theory and give one modern example that supports or refutes it.
Answer: Malthus argued population grows faster than food, causing famine unless checked. Modern example: Green Revolution increased food production, challenging the theory, but some argue climate change may revive Malthusian concerns.